How Doré makes money
The business model is one sentence: Doré originates commodity-finance yield, passes most of it to token holders, and keeps the spread. Everything below is that sentence with numbers on it — the plan as the investor deck states it, then what our own proofs say about whether the plan closes.
The deck is a hashed source (cc0d990f…29e91a, August 2026) and every figure
attributed to it here is quoted rather than paraphrased.
Where the yield comes from
The claim is not that Doré earns more by taking more risk. It is that an entire asset class sits outside on-chain credit, and its yield reflects operational difficulty rather than volatility.
| What is funded on-chain today | Backing | Yield |
|---|---|---|
| Tokenised treasuries | US government paper | 4.0–4.5% |
| Staked / structured stables | Derivatives funding | 3.5–7% |
| On-chain private credit | Mixed | 4–9% |
| GPU and AI hardware loans | Depreciating equipment | ~8% |
| Physical commodity trade finance | Metal in custody | 10–15% |
The reason the last row is unfilled is structural. Basel capital rules pushed banks out of exactly this lending after 2008 — not because it defaults, but because it is small-ticket, operationally intensive and unattractive against risk-weighted capital. The demand did not go away and the collateral did not get worse. That is the same diagnosis as the gap, stated from the capital side.
The split
The deck's yield model is a deliberate glide path: pass nearly everything through early to win deposits, then step the pass-through down as the reserve grows.
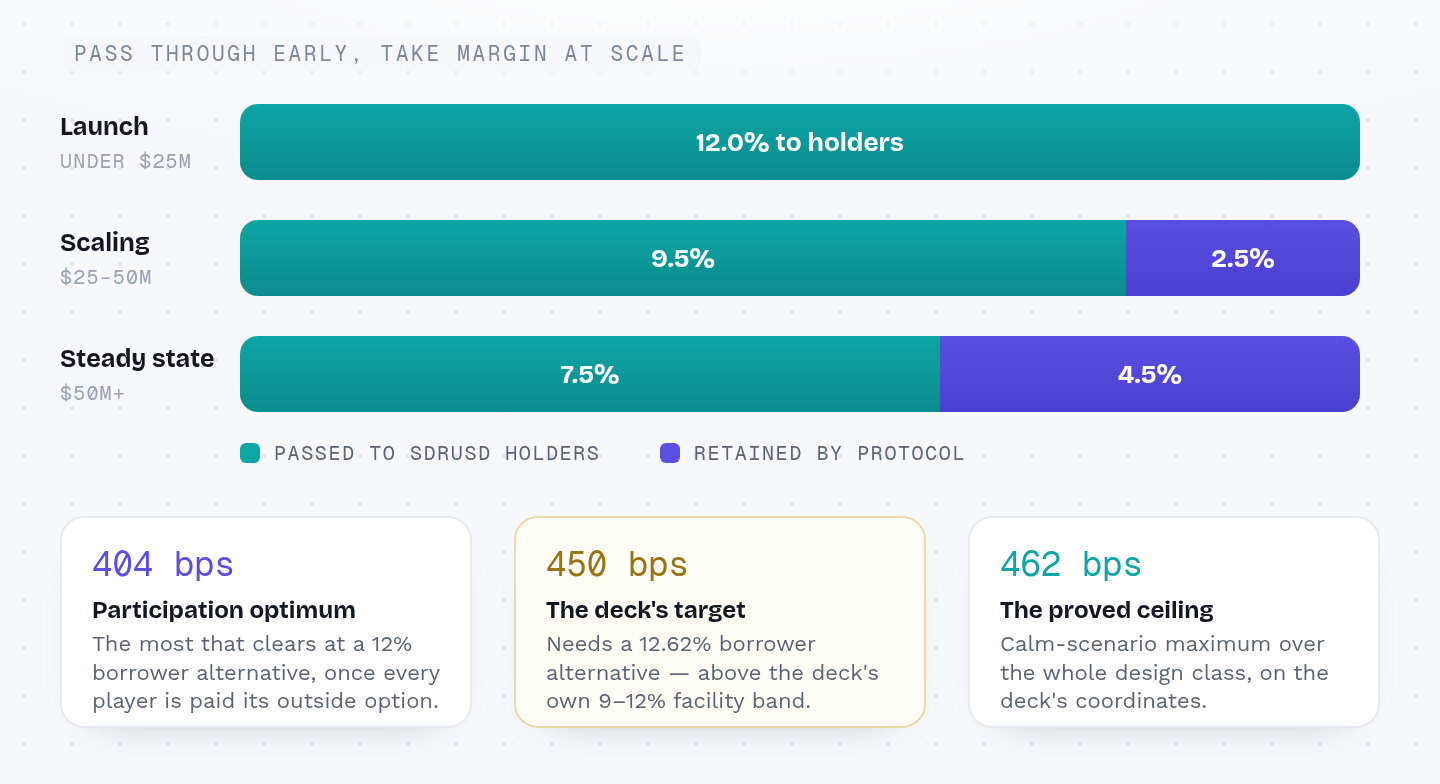
Two things make this credible on its own terms. A 7.5% pass-through is roughly double what the largest yield-bearing dollars pay. And the retained margin is not a fee levied on the holder — it is the spread between what commodity borrowers pay and what on-chain capital expects.
Why it scales
Protocol revenue is the retained margin times the reserve, and the cost base is close to fixed:
| Reserve | Revenue at 4.5% |
|---|---|
| $50m | $2.25m |
| $100m | $4.5m |
| $200m | $9.0m |
| $500m | $22.5m |
| $1.0bn | $45.0m |
The deck's year-one cost base is itemised — ADGM SPV $10–15k, FSRA authorisation $120–160k including $50k of locked regulatory capital, counsel $220–280k, audit and attestation $180–260k, monitoring $90–130k. Roughly $620–845k, against which $50m of reserve covers the cost base and everything past that is margin.
The scaling argument is that the same team runs $1bn that runs $100m, so originated capacity, not operating capacity, sets the ceiling — and originated capacity is stated as exceeding $875m across gold, silver and copper. Whether headcount really stays flat across a twentyfold increase in reserve is a judgment, not a proof, and we do not model it.
What our proofs say about the plan
This is where the documentation stops repeating the deck and starts checking it.
The ceiling agrees with the deck's framing. Calibrated on the deck's own
disclosed coordinates, the maximum a protocol in this design class can earn in
a calm year is 462 basis points, inside a band of 357–567 across the deck's
stated range (deck_ceiling_band). The deck's 4.5% target and the proved
ceiling are the same order of magnitude, which is a real, non-trivial
agreement: the plan is not fantastical.
But the target sits above the participation-feasible optimum. Once every
player has an outside option it must be paid, the optimum at a 12% borrower
alternative clears 404 bps, not 450 (participation_frontier). The payoff
is linear in the borrower's alternative at 75 bps per 100, so a 450-bps margin
requires a borrower alternative of 12.62% (deck_margin_target_needs_1262).
The deck's facility page states the asset yield as 9–12%. Its opportunity and comparison pages state the asset class at 10–15%. A 12.62% requirement is outside the first band and inside the second.
So the finding is precise and it is not that the plan fails. It is that the deck is internally inconsistent about its own yield, and its revenue target is reachable only under the wider framing. Anyone underwriting this should ask which number is the real one, because the answer determines whether the steady-state margin is achievable at all.
Four things a careful reader should check
Reading the deck against the project's own later analysis surfaces four places where the marketing runs ahead of the documents. We publish them because a reader would otherwise find them during diligence, and because the discipline this project is built on makes concealing them absurd.
The stated yield is inconsistent. 9–12% on the facility page, 10–15% on the opportunity and comparison pages, "approximately 12%" blended in the yield model. These cannot all be the operative number.
The insurance is described more broadly than the policy supports. The deck says a non-payment policy "covers the full USD 300m" and that a cut-through clause gives the noteholder "direct recourse" to the reinsurer. The later capstone analysis, working from the actual policy, records that the Tranche 1 policy names a different insured and a USD 10m insured amount, and that those policy rights cannot be assigned without the leading insurer's approval; loss-payee status needs an approved endorsement. Its explicit instruction is not to promise direct insurance rights that the documents have not granted.
"Instant exit" overstates the redemption design. The deck's liquidity page is headed slow underneath, instant on top and says anyone can exit immediately at market. The later analysis reverses the second half — slow underneath, honest on top — and warns against promising stablecoin-style instant redemption against illiquid private credit unless someone has explicitly committed the liquidity. The 30-day queue is the real primary redemption path; the pool is a secondary market, and secondary markets can trade at a discount.
The leverage flywheel is a distribution feature, not financing. The deck's growth page shows 3× to 20× loops implying returns from 14% to 103%. The deck itself labels the table illustrative and not a projection, which is fair — but the deeper point is that a leverage loop creates no new commodity financing. Twenty times TVL is not twenty times deployed capital. The honest metric is real deployed capital, reported separately from total value locked.
The bottom line
The economics work if two conditions hold: the asset class genuinely pays above about 12.6% to the facility, and the protocol reaches roughly $50m of reserve to clear its fixed costs. The first is a question about the market and is currently answered inconsistently by our own primary source. The second is a question about distribution.
Neither is a question about the protocol's design, and that is the useful result. The design's maximum has been searched exhaustively and proved; what remains uncertain is priced input, not architecture.